• Welcome Guest
  • View Cart
  • Phone (US): 703.778.3080
  • 0Shopping Cart
  • Market Reports
  • Market Research Subscriptions
    • Knowledge Center
  • Custom Market Research
    • Quantitative Market Research
    • Qualitative Market Research
    • RateMyProduct
  • Blog
  • Featured
    • Free Downloads
    • View Webinars On-Demand
    • The IVD Market in 2023: $130 Billion and Growing
    • The Point of Care Testing Market
    • Immunoassays
  • About Us
    • Contact
  • Search
  • Menu Menu
  • Biotechnology
    • Next Generation Sequencing
    • Proteomics
    • Biopharmaceuticals
    • Instrumentation & Equipment
    • Emerging Technologies
  • Pharmaceuticals
    • Vaccines
    • Drug Delivery
    • Over-the-Counter
    • Drug Discovery
    • Cancer Treatment
    • Manufacturing & Packaging
    • Prescription Drugs
  • Diagnostics
    • Molecular Assays
    • Point-of-Care
    • Immunoassays
    • Infectious Disease
    • Clinical Chemistry
    • Oncology & Hematology
    • Lab Testing Services
    • Medical Imaging
  • Healthcare
    • Information Technology
    • Facilities & Settings
    • Insurance & Managed Care
  • Medical Devices
    • Wound Care
    • Drug Delivery
    • Equipment
    • Surgical
  • Login

Filter your search

Search Report Keyword
Price
CATEGORIES
  • Biotechnology Market Research
  • cell and gene therapy
  • cell therapy
  • Diagnostics Market Research
  • gene therapy
  • Healthcare Information Technology
  • Healthcare Market Research
  • in vitro diagnostic
  • IVD
  • life sciences
  • Medical Devices Market Research
  • Molecular & Nucleic Acid Testing
  • Pharmaceuticals Market Research
  • Point-of-Care Diagnostics
  • sciences
  • vaccines

Knowledge Center Sidebar

Most Popular Research

  • Cell and Gene Therapy Business Outlook
  • The Worldwide Market for In Vitro Diagnostic Tests, 14th Edition
  • Clinical Diagnostics MasterFile
  • The Global Market for Medical Devices, 11th Edition
  • The World Market for Molecular Diagnostics Tests, 10th Edition
  • Remote Patient Monitoring and Telehealth Markets, 12th Edition

Cell and Gene Therapy Market and Deals Analysis, 2023: Financings, Partnering, Mergers and Acquisitions, Tech Transfers, IPOs, and Other Deals

$5,000.00 – $10,000.00

Clear
SKU: 23-022 Categories: cell and gene therapy, cell therapy, gene therapy, life sciences, Pharmaceuticals, Pharmaceuticals Market Research, sciences Tags: cell and gene therapy, cell therapy, gene therapy, IPOs, M&A, mergers and acquisitions IVD Pages: 261
  • Description
  • Table of Contents
  • Latest reports

Description

This report, Kalorama’s Cell and Gene Deals and Market Analysis, tracks the dealmaking and market opportunity in cell and gene therapy.   The report includes specific details of 1000+ deals from 2022-2023.   A lot of attention is being given to the areas related to cell and gene therapy (CGT) recently. Kalorama’s CGT deals amounted to a staggering $40 billion in 2022.  Understanding the deals that have been made, who is making them, and what the specific details are is critical to understanding how to take advantage of the market opportunity in one of the fastest-growing pharma markets.

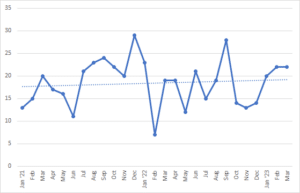
EXAMPLE CHART: Total Number of VC/ Private Funding Deals by Month, Jan 2021-Mar 2023

Kalorama’s report is designed to provide companies entering or already in this market information on the deals that will shape future growth and competition.

The following is just some of the information in this report:

  • Specific details of 1000+ Cell and Gene Therapy Deals from 2022-2023
  • Venture Capital/Private Funding Round Amounts, By Quarter
  • Chronological Trends Presented in Multiple Categories (VC, M&A, Other Areas)
  • Deals by Type – Technology/Research/Strategic Collaboration; Venture Capital/Private Investment; Acquisition, Merger, Strategic Investment; Licensing; Public Offering/SPAC; Manufacturing, Supply Chain; Outreach, Philanthropy, Education; Distribution, Co-Marketing; Spinout, Restructure; Conclude/Terminate Deal; Joint Venture; and Settle Litigation
  • Most Active Deal-Making Companies, by Type of Deal (Acquisition/Merger/ Strategic Investment, Overall Deals, Collaborations)
  • Regional Breakdown of Dealmaking [North America, Europe, APAC, Rest of World] (%)
  • Most Frequent Types of Deals, by Quarter, by Category [Technology/Research/Strategic Collaboration; Venture Capital/Private Investment; Acquisition, Merger, Strategic Investment; Licensing; Public Offering/SPAC; and Manufacturing, Supply Chain] (Total number)
  • Estimated Market Forecasts for Cell and Gene Therapies by Type (Gene Therapy, Cell Therapy)
  • Estimated Market Forecasts by Region (North America, EU, APAC, Other)
  • Estimated Market Forecasts for CGT by Disease Category (Oncology, Other)

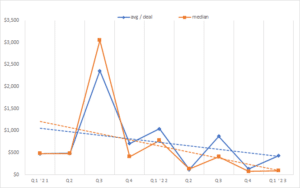
EXAMPLE CHART: Average Merger/Acquisition Amount, By Quarter [Q1 2021-Q1 2023] ($M)

No report published by a major market research publisher has tackled the Cell and Gene Therapy dealmaking space as it exists in 2023 in a more comprehensive fashion.  As Cell and Gene Therapy is a highly competitive marketplace, hundreds of companies are referenced in this report.

While the concepts of gene therapy and cell therapy have been investigated for decades, there were major challenges in the early years.  Through incremental progress, and the gradual introduction of enabling tools such as CRISPR and next-generation sequencing (NGS), cell and gene therapy has emerged into a highly active area.  There are now many approved therapies with proven track records.

As the new tools have lowered the barriers to entry for the industry, over 1,500 companies have been created or have become involved.

Table of Contents

Chapter 1: Executive Summary

Introduction
$40.2 Billion in Funding During 2022
  • Figure 1-1: Total Deals per Month, April 2021-March 2023 (Total count)
  • Figure 1-2: Total Deals per Month by Type, Apr 2021-Mar 2023 [VC/ Private, IPO/FPO/SPAC; and All Other Deals] (Total count)
Quarterly Funding Amounts
  • Table 1-1: Total Quarterly Funding, by Type, Q1 2021-Q4 2021 [M&A; Venture Capital/Private; IPO/FPO; Collab; SPAC; and Strat inv] ($M)
  • Table 1-2: Total Quarterly Funding, by Type, Q1 2022-Q1 2023 [M&A; Venture Capital/Private; IPO/FPO; Collab; SPAC; and Strat inv] ($M)
  • Figure 1-3: Total Quarterly Funding, Q1 2021- Q1 2023 ($M)
  • Figure 1-4: Total Quarterly Funding, by Type, Q1 2021-Q1 2023 [M&A; Venture Capital/Private; IPO/FPO; Collab; SPAC; and Strat inv] ($M)
Quarterly Funding Category Shares, Q1 2021 Through Q1 2023
  • Table 1-3: Total Quarterly Funding Share, by Type, 2021 [M&A; Venture Capital/Private; IPO/FPO; Collab; SPAC; and Strat inv] (%)
  • Table 1-4: Total Quarterly Funding Share, by Type, Q1 2022-Q1 2023 [M&A; Venture Capital/Private; IPO/FPO; Collab; SPAC; and Strat inv] (%)
  • Figure 1-5: Q1 2022 Funding Share, by Type of Funding [M&A; Venture Capital/Private; IPO/FPO; Collab; SPAC; and Strat inv] (%)
  • Figure 1-6: Q2 2022 Funding Share, by Type of Funding [M&A; Venture Capital/Private; IPO/FPO; Collab; SPAC; and Strat inv] (%)
  • Figure 1-7: Q3 2022 Funding Share, by Type of Funding [M&A; Venture Capital/Private; IPO/FPO; Collab; SPAC; and Strat inv] (%)
  • Figure 1-8: Q4 2022 Funding Share, by Type of Funding [M&A; Venture Capital/Private; IPO/FPO; Collab; SPAC; and Strat inv] (%)
  • Figure 1-9: Q1 2023 Funding Share, by Type of Funding [M&A; Venture Capital/Private; IPO/FPO; Collab; SPAC; and Strat inv] (%)

Quarterly Deal Counts by Category, Q1 2021 – Q1 2023

  • Table 1-5: Quarterly Count of Deals, By 2021 Quarter, By Category [Technology/Research/Strategic Collaboration; Venture Capital/Private Investment; Acquisition, Merger, Strategic Investment; Licensing; Public Offering/SPAC; Manufacturing, Supply Chain; Outreach, Philanthropy, Education; Distribution,  Co-Marketing; Spinout, Restructure; Conclude/Terminate Deal; Joint Venture; and Settle Litigation] (total number) (%)
  • Table 1-6: Quarterly Count of Deals, by Quarter Q1 2022-Q1 2023, By Category [Technology/Research/Strategic Collaboration; Venture Capital/Private Investment; Acquisition, Merger, Strategic Investment; Licensing; Public Offering/SPAC; Manufacturing, Supply Chain; Outreach, Philanthropy, Education; Distribution, Co-Marketing; Spinout, Restructure; Conclude/Terminate Deal; Joint Venture; and Settle Litigation] (total number) (%)

Growth in Collaborations, Manufacturing/Supply Chain Deals, Licensing, Distribution/ Co-Marketing Highlight Activity in Cell and Gene Therapy

  • Figure 1-10: Most Frequent Types of Deals, by Quarter, by Category [Technology/Research/Strategic Collaboration; Venture Capital/Private Investment; Acquisition, Merger, Strategic Investment; Licensing; Public Offering/SPAC; and Manufacturing, Supply Chain] (Total number)

A Look at Less Frequent CGT Deal Types

  • Figure 1-11: Lower Frequency Deal Types, by Quarter, by Category [Outreach, Philanthropy, Education; Distribution, Co-Marketing; Spinout, Restructure; Conclude/Terminate Deal; Joint Venture; and Settle Litigation] (total number)
  • Figure 1-12: Merger/ Acquisition Amount, by Quarter [Q1 2021 – Q1 2023] ($M)
  • Figure 1-13: Venture Capital/Private Funding Round Amount, by Quarter [January 2021-January 2022] ($M)
  • Figure 1-14: IPO/FPO Amount, by Quarter [Q1 2021-Q1 2023] ($M)
  • Figure 1-15: SPAC Portion Amount, by Year and Q1 2023 ($M)
Synopsis of Most Active Deal-Making Companies
  • Table 1-7: Most Active Companies’ Deal-Making Rankings, by Category, 2021-Q1 2023 (Rank)
  • Table 1-8: Most Active Companies in Overall Deals, Collaborations
  • Figure 1-16: Most Active Companies in Overall Deals, Collaborations


Chapter 2: Venture Capital & Private Funding

VC/Private Funding in Flux
  • Figure 2-1: Total Number of VC/ Private Funding Deals by Month, January 2021-March 2023 (Total count)
  • Figure 2-2: Average VC/ Private Funding Round Amount, By Quarter Q1 2021-Q1 2023 ($M)
  • Table 2-1: Regional Venture Capital/Private Funding, by Quarter Q1 2021-Q1 2023,  [North America, Europe, APAC, Rest of World] ($M) (%)
  • Figure 2-3: Quarterly Venture Capital/Private Total Funding, Q1 2021- Q1 2023, by Region [North America, Europe, APAC, Rest of World] ($M)
  • Table 2-2: Regional Venture Capital/Private Funding Shares, by Quarter Q1 2021-Q1 2023,  [North America, Europe, APAC, Rest of World] (%)
  • Figure 2-4: Regional Venture Capital/Private Funding Shares, by Quarter Q1 2021 Q1 2023,  [North America, Europe, APAC, Rest of World] (%)
  • Figure 2-5: Venture Capital/Private Funding Round Amounts, By Quarter [Q1 2021-Q1 2023] ($M)
  • Table 2-3: Venture Capital/Private Fundraising Deals, Q1 2023
  • Table 2-4: Venture Capital/Private Fundraising Deals, Q4 2022
  • Table 2-5: Venture Capital/Private, Q3 2022
  • Table 2-6: Venture Capital/Private Fundraising Deals, Q2 2022
  • Table 2-7: Venture Capital/Private Fundraising Deals, Q1 2022


Chapter 3: Strategic Investments

Strategic Investments in Cell and Gene Therapy
  • Figure 3-1: Total Number of Strategic Investments, By Quarter [Q1 2021-Q1 2023] (Total count)
  • Figure 3-2: Average Strategic Investment Amount, By Quarter [Q1 2021-Q1 2023] ($M)
  • Figure 3-3: Total Strategic Investments, By Quarter [Q1 2021-Q1 2023] ($M)
  • Table 3-1: Strategic Investment Total Amounts, Counts, and Averages, by Quarter, Q1 2021 Q1 2023,  ($M)
  • Table 3-2: Strategic Investments, January 2021-April 2023
Most Active Companies
  • Table 3-3: Most Active in Acquisition/Merger/ Strategic Investment
  • Figure 3-4: Most Active in Acquisition/Merger/ Strategic Investment


Chapter 4: IPOs, FPOs, & SPACs

North America Sees the Majority of Proceeds from IPOs, FPOs, SPACs
  • Figure 4-1: Total Number of IPOs/ FPOs, By Month [Jan 2021-Mar 2023] (Total count)
  • Figure 4-2: Average IPO/ FPO Proceeds, By Quarter [Q1 2021-Q1 2023] ($M)
  • Table 4-1: Quarterly IPO/ FPO Total Funding, Q1 2021 Q1 2023,  by Region [North America, Europe, APAC] ($M)
  • Figure 4-3: Total IPO/ FPO Funding, By Quarter, by Region [Q1 2021-Q1 2023] ($M)
  • Table 4-2: Regional IPO/ FPO Funding Shares, by Quarter, Q1 2021 Q1 2023,  [North America, Europe, APAC] (%)
  • Figure 4-4: Regional IPO/FPO Funding Shares, By Quarter, Q1 2021 Q1 2023 [North America, APAC, and Europe) (%)
  • Figure 4-5: IPO/FPO Amounts, By Quarter [Q1 2021-Q1 2023] ($M)
  • Table 4-3: Quarterly SPAC Funding Portion, Q1 2021-Q1 2023 ($M)
  • Figure 4-6: Quarterly SPAC Funding Portion Total and Average, Q1 2021-Q1 2023 ($M)
  • Table 4-4: IPO/FPO Deals, Q1 2023
  • Table 4-5: IPO/FPO Deals, Q4 2022
  • Table 4-6: IPO/FPO Deals, Q3 2022
  • Table 4-7: IPO/FPO Deals, Q2 2022
  • Table 4-8: IPO/FPO Deals, Q1 2022
  • Table 4-9: SPAC Portion, January 2021-Mar 2023 ($M)
  • Figure 4-7: SPAC Portion Amount, by Year, ’21, ’22, Q1 2023 ($M)


Chapter 5: Mergers & Acquisitions (M&A)

Growing Numbers of M&A, Despite Lower Average Value
  • Figure 5-1: Total Number of Mergers and Acquisitions, By Month [Jan 2021-Mar 2023] (Total Count)
  • Figure 5-2: Average Merger/Acquisition Amount, By Quarter [Q1 2021-Q1 2023] ($M)
  • Table 5-1: Quarterly Merger and Acquisition Values, Counts, and Averages, Q1 2021-Q1 2023 ($M) (Total count)
  • Figure 5-3: Merger/ Acquisition Transactions Global Total, By Quarter [Q1 2022- Q1 2023] ($M)
  • Figure 5-4: Merger/ Acquisition Amounts, by Quarter [Q1 2021- Q1 2023] ($M)
  • Table 5-2: Mergers and Acquisitions Announcements, Q1 2023 ($M)
  • Table 5-3: Mergers and Acquisitions, Q4 2022 ($M)
  • Table 5-4: Mergers and Acquisitions, Q3 2022 ($M)
  • Table 5-5: Mergers and Acquisitions, Q2 2022 ($M)
  • Table 5-6: Mergers and Acquisitions, Q1 2022 ($M)
Most Active Companies
  • Table 5-7: Most Active in Acquisition/Merger/Strategic Investment
  • Figure 5-5: Most Active in Acquisition/Merger/ Strategic Investment


Chapter 6: Technology/Research/Strategic Collaborations

CGT Market Sees a Broad Variety of Collaborations
  • Figure 6-1: Total Number of Tech/ Research/ Strategic Collaborations, By Month [Jan 2021-Mar 2023] (Total count)
  • Figure 6-2: Total Number of Collaborations with Upfront and/or Milestone Payments, By Quarter [Q1 2021-Q1 2023] ($M)
  • Table 6-1: Collaboration Upfront and Future/ Milestone Payments, Counts, Averages, Q1 2021-Q1 2023 ($M) (Total count)
  • Figure 6-3: Average Collaboration Upfront Payment, By Quarter [Q1 2021-Q1 2023] ($M)
  • Figure 6-4: Total Collaboration Upfront Payments, By Quarter [Q1 2021-Q1 2023] ($M)
  • Figure 6-5: Average Collaboration Future/ Milestone Payments, By Quarter [Q1 2021-Q1 2023] ($M)
  • Figure 6-6: Total Collaboration Future/ Milestone Payments, By Quarter [Q1 2021-Q1 2023] ($M)
  • Table 6-2: Technology/Research/Strategic Collaboration Deals, January 2022–April 2023
Most Active Companies
  • Table 6-3: Most Active in Research/Strategic Collaborations
  • Figure 6-7: Most Active in Research/Strategic Collaborations


Chapter 7: Licensing

Stable Levels of Licensing in the Cell and Gene Therapy Market
  • Figure 7-1: Total Number of Licensing Deals, By Month [Jan 2021-Mar 2023] (Total count)
  • Table 7-1: Licensing Deals, January 2022-April 2023
Most Active Companies
  • Table 7-2: Most Active Companies in Licensing Deals
  • Figure 7-2: Most Active Companies in Licensing Deals


Chapter 8: Manufacturing and Supply Chain

Major Growth in Manufacturing and Supply Chain Management Activity in CGT
  • Figure 8-1: Total Number of Supply/ Manufacturing Deals, By Month [Jan 2021-Mar 2023] (Total count)
  • Table 8-1: Manufacturing and Supply Chain Deals, January 2022-March 2023
Most Active Companies
  • Table 8-2: Most Active Companies in Manufacturing/Supply Deals
  • Figure 8-2: Most Active Companies in Manufacturing/Supply Deals


Chapter 9: Public Outreach, Education, & Philanthropy

CGT Market Focusing Less on Public Outreach, Patient/ Consumer/ Trainee Education, and Philanthropy
  • Figure 9-1: Total Number of Outreach/ Philanthropy/ Education Deals, By Month [Jan 2021-Mar 2023] (Total count)
  • Table 9-1: Outreach, Education, & Philanthropy Deals, January 2022-Apr 2023


Chapter 10: Distribution & Co-Marketing

A Look at CGT Distribution and Co-Marketing Deals
  • Figure 10-1: Total Number of Distribution/ Co-Marketing Deals, by Month [Jan 2021-Mar 2023] (Total count)
  • Table 10-1: Distribution & Co-Marketing Deals, January 2022-Mar 2023
Most Active Companies
  • Table 10-2: Most Active Companies in Distribution/Co-Marketing Deals
  • Figure 10-2: Most Active Companies in Distribution/Co-Marketing Deals


Chapter 11: Other – JV, Restructuring, Termination, Spinoffs

A Look at Other Types of Deals Impacting Cell and Gene Therapy
  • Figure 11-1: Total Number of JV, Restructuring, Termination, By Month [Jan 2021-Mar 2023] (Total count)
  • Table 11-1: Restructuring, JV, Termination, Spinoffs, January 2022-April 2023


Chapter 12: Other – New Facilities, Expansion; Real Estate

Expansion, New Facilities and Related Announcements
  • Table 12-1: New Facilities, Expansion; Real Estate Deals, January 2022-April 2023


Appendix: Cell and Gene Therapy Market Assessment

Market Outlook, 2022-2032
  • Table A-1: Cell and Gene Therapy Market Revenues by Product Type, 2022 and Projected 2027 and 2032  ($ millions)
  • Figure A-1: Cell and Gene Therapy Market Revenue Share, by Product Type [Cardiovascular-Blood, Dermatological, Musculoskeletal, Neurology, Oncology, Ophthalmic, Other Conditions] (%)
Regional Market
  • Table A-2: Cell and Gene Therapy Market by Country/Region [Europe, United States, Other Countries], 2022 Projected 2027 and 2032 ($ millions)
Products on the Market
  • Table A-3: Major Cell and Gene Therapy Product Approvals, FDA
Top Companies in Cell and Gene Therapy
  • Figure A-2: Leading Companies in Cell and Gene Therapy, By Company [Amylan, Bristol Myers, Dendreon, Gilead, Novartis, Smith and Nephew, Others]


    Cell and Gene Therapy Market Dynamics by Disease Type: Development, Trends, and Forecasts, 4th Edition (2024-2030)
    April 11, 2025
    Cell and Gene Therapy Market Deals: Investment, M&A, and Partnerships, 2021-2025 (3rd Edition)
    February 13, 2025
    Cell and Gene Therapy Deals Analysis, 2021-2024
    June 3, 2024
    Cell Therapy and Gene Therapy Markets (Markets by Disease Type), 2023-2029
    April 30, 2024

Related products

  • Placeholder image

    Men’s Health: The World Market for Current and Emerging Drug Therapies

    $2,625.00 – $5,250.00
  • Placeholder image

    Early Stage Drug Discovery 2004: Combi-chem & High Throughput Screening Revisited

    $2,995.00 – $5,990.00
  • Placeholder image

    OTC Women’s Health: A Supplement to Women’s Health, 3rd Edition

    $1,496.00 – $2,992.00
  • Placeholder image

    Women’s Health: Worldwide Prescription Drug Markets – 3rd Edition

    $2,812.00 – $5,625.00

Contact Us

  • 671 North Glebe Road, Suite 1610 Arlington, VA 22203 United States

  • Email Us

  • 703-778-3080

  • Send us a message!

Pay Invoice

  • Pay an Invoice by Credit Card

Follow Us!

Latest Blogs

  • 4 Fascinating Facts About Cancer Diagnostics March 4, 2025
  • Food Animal Diagnostics Market: Spotlight on Disease Testing Amid Bird Flu Surge February 20, 2025
  • Custom Competitive Intelligence (CI) Research: A New Strategic Imperative For Lab Diagnostics Companies  February 19, 2025
  • The Rise of Pharmacodiagnostics in the $10 Billion Global Cancer Diagnostics Market February 1, 2025
  • IVD Trends to Watch: Personalized Medicine Adds Precision to Diagnostic Testing January 2, 2025

Sitemap

  • Home
  • About
  • Blog
  • Contact
  • Sitemap

Your Data and Privacy

  • View our Privacy Policy
  • GDPR Statement
  • Privacy Settings

About Us

Kalorama Information, part of Science and Medicine Group, has been a leading publisher of market research in medical markets, including the biotechnology, diagnostics, medical device, and pharmaceutical industries for more than 30 years. Our comprehensive, timely, quality research and innovative approach to analysis and presentation of market intelligence have made Kalorama Information a premier source of market information for top industry decision makers.

Visit Science and Medicine Group
Clinical Laboratory Services Market, 8th Edition At-Home Diagnostic Testing Markets and Trends (COVID-19, FOB, Glucose, HIV and...
Scroll to top