Understanding the Clinical Diagnostics Customer Experience
We recently published a customer experience survey. This blog highlights discusses the report and highlights the major findings of the report, including important recommendations for the clinical diagnostics industry. For specific vendor performance and user ratings, a purchase of the report is suggested.
Clinical laboratory customers have become increasingly sophisticated and typically have multiple suppliers in every product category from which to choose. Leading diagnostics suppliers seek to differentiate themselves by improving both the tangible and intangible ways they interact with their customers. With the high cost of customer acquisition, the easiest way to increase profitability is to develop one’s current customer accounts. Improving the customer experience through innovation, mass customization and customer intimacy programs is a key strategy many life science companies are pursuing.
Innovation is not limited to developing revolutionary new products. Innovation can also be incorporated in the ways customers find, buy and use your products.
Smart companies continually evaluate customer reactions to multiple touchpoints so that they can offer the kind of experience that inspires customers to want to come back. Diagnostics suppliers will be challenged as to how to get beyond “better sameness” to create truly memorable customer experiences. The question becomes one of how to best to enhance the quality of the customer experience in a remarkably homogenous marketplace.
In our latest report, Benchmarking for 2019: Understanding the Clinical Diagnostics Customer Experience, we asked more than 300 clinical lab professionals to evaluate 21 different diagnostics companies on 18 critical customer touchpoints. Here at Kalorama Information, we have developed a customer experience model for the diagnostics market. Every time a laboratory professional interacts with a supplier in any way, that moment is a customer experience touchpoint and as such, a branding opportunity. The scope of our report spans the pre-purchase, product-usage and post-purchase customer experience over the course of the purchasing life cycle. It is summarized in the following graphic:
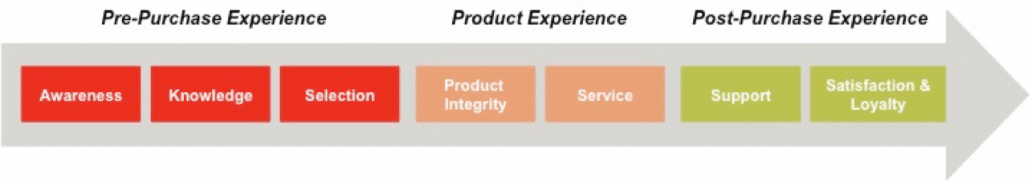
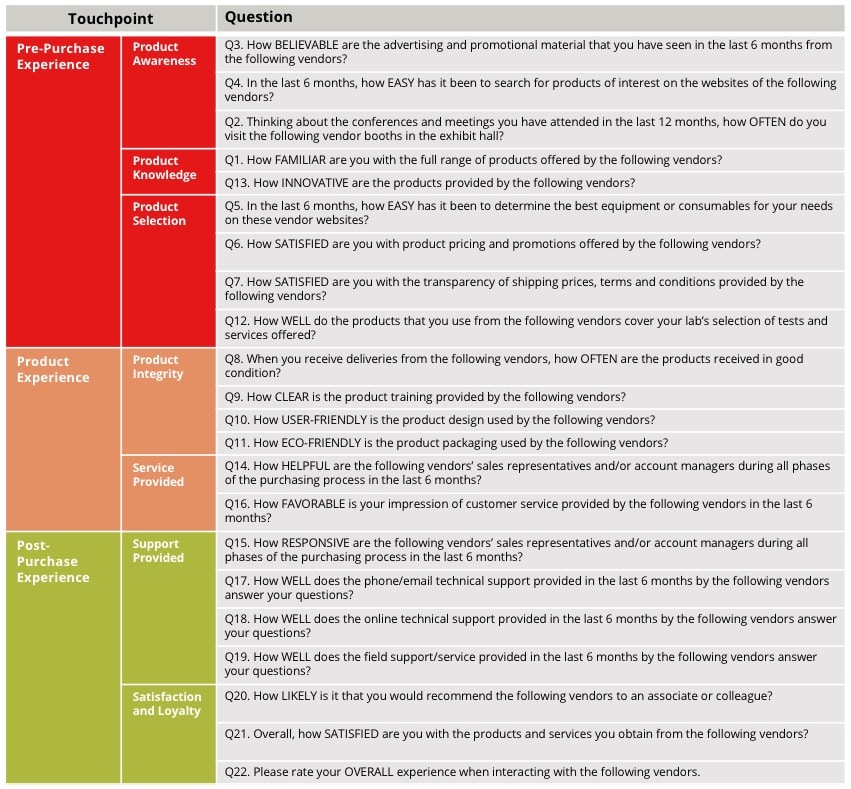
The questions we developed to cover each touchpoint were designed to capture the attributes that are valued by clinical lab professionals. Touchpoints encompass the time spent researching products, the selection process and after the sale is made. Within each touchpoint, we asked customers multiple questions to capture the attributes valued by clinical diagnostics customers. These touchpoints encompass the experiences that lead to repurchase and recommendation of clinical diagnostic equipment and consumables.
Purchasing life cycle questions were asked on an 11-point scale (some with a not applicable option) where “Positive” is a rating of 9-10 and “Negative” is a rating of 0 to 6. Performance is calculated using a Net Promoter Score (NPS)-like methodology; that is, Performance = percentage of Positive responses minus the percentage of Negative responses. This provides a respondent-level view of touchpoint performance. Values for every vendor at each touchpoint are compared to an industry-specific average to provide an understanding as to how each supplier is perceived compared to this average. An awareness of the importance assigned to each touchpoint allowed us to create a weighted overall Customer Experience Score for each supplier, as well as establish an industry-specific standard that is used as a benchmark throughout this report.
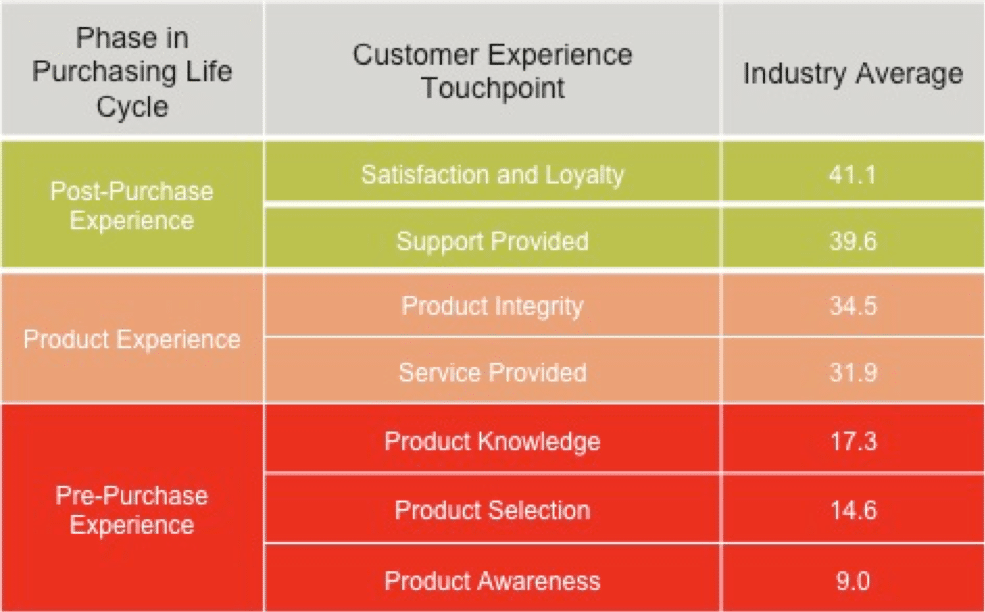
Awareness of the breadth of a supplier’s product line has the lowest industry average value. This suggests suppliers must continue to invest in resources to fulfill this need for information, a need that is especially acute during the pre-purchase phase of the purchasing cycle. These investments range from user-friendly and intuitive website design, search engine optimization, and the development of comprehensive website content. This will also assist in the Product Selection touchpoint where the industry is clearly under-performing.
Suppliers who focus their customer experience efforts on outperforming the industry’s averages are those who will achieve the competitive advantage and differentiation they seek.
The suppliers evaluated in our report are:
- Abbott
- Agilent
- BD Biosciences
- Beckman Coulter
- Bio-Rad
- bioMerieux
- Bruker
- Cepheid
- DiaSorin
- GenMark Diagnostics
- Illumina
- Luminex
- Ortho Clinical Diagnostics
- Quidel
- Roche
- Sekisui Diagnostics
- Siemens Healthineers
- Sysmex
- Thermo Fisher Scientific
How did your company compare to the industry average at each touchpoint? The full report contains detailed profiles and comparisons of 21 leading suppliers. In addition, a companion interactive report gives you the ability to filter the data by company, market segment, region and touchpoint to conduct your own analysis and presentations.
Please download our complimentary report summary.

