While the concepts of gene therapy and cell therapy have been investigated for decades, there were major challenges in the early years. Through incremental progress, and the gradual introduction of enabling tools such as CRISPR and next-generation sequencing (NGS), cell and gene therapy has emerged into a highly active area. There are now many approved therapies with proven track records.
As the technologies have lowered the barriers to entry for the industry, over 1,500 therapy or tools companies have been created or have become involved in this field.
This report, Kalorama’s Cell and Gene Therapy Funding and Deals Analysis: Financings, Partnering, M&A, Tech Transfers, IPOs/SPACs, Other Deals, 2021-2023, tracks the dealmaking activities in cell and gene therapy since 2021. The report provides informative graphs of quarterly trends from 2021-2023, and also includes the specific details of over 2,000 deals covering the Q1 2022-Q3 2023 period. A lot of attention and funding is being given to the areas related to cell and gene therapy (CGT) recently. Kalorama’s tracked CGT investments, acquisitions, and other deals amounted to more than $20 billion in the first three quarters of 2023. Understanding the volumes of deals that have been made, who is making which type and how many, and the deals’ details, is critical to finding how to take advantage of the opportunities in one of the fastest-growing markets.
Kalorama’s report is designed to provide companies entering or already in this market with knowledge of the trends in deals that will shape future growth and competition.
The following is just some of the information in this report:
Quarterly Funding Amounts 2021-2023
Specific details of 2000+ CGT Deals from 2022-2023
Venture Capital/Private Funding Round Amounts, By Quarter
Chronological Trends Presented in Multiple Categories (VC, M&A, Other Areas)
Deals by Type – Technology/Research/Strategic Collaboration; Venture Capital/Private Investment; Acquisition, Merger, Strategic Investment; Licensing; Public Offering/SPAC; Manufacturing, Supply Chain; Outreach, Philanthropy, Education; Distribution, Co-Marketing; Spinout, Restructure; Conclude/Terminate Deal; Joint Venture; and Settle Litigation
Most Active Deal-Making Companies, by Type of Deal (Acquisition/Merger/ Strategic Investment, Overall Deals, Collaborations)
Regional Breakdown of Dealmaking [North America, Europe, APAC, Rest of World] (%)
Most Frequent Types of Deals, by Quarter, by Category [Technology/Research/Strategic Collaboration; Venture Capital/Private Investment; Acquisition, Merger, Strategic Investment; Licensing; Public Offering/SPAC; and Manufacturing, Supply Chain] (Total number)
No report published by a major market research publisher has tackled the current Cell and Gene Therapy dealmaking space more comprehensively.
There isn’t a more comprehensive exploration of the current Cell and Gene Therapy dealmaking landscape by any major market research publisher. As Cell and Gene Therapy is becoming a highly competitive marketplace, over a thousand companies are specifically referenced in this report.
Table of Contents
Chapter 1: Executive Summary
Introduction
$27.1 Billion in Investment in First Nine Months of 2023
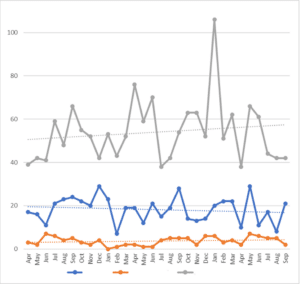
Figure 1-1: Total Deals per Month, Apr 2021-Sep 2023 (count)
Figure 1-2: Total Deals per Month by Type, Apr 2021-Sep 2023 [VC/Private, IPO/FPO/SPAC; and All Other Deals] (count)
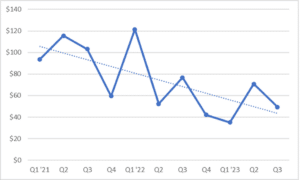
Quarterly Funding Amounts
Table 1-1: Total Quarterly Funding, by Type, Q1-Q3 2023 [M&A; Venture Capital/Private; IPO/FPO; Collab; SPAC; and Strat inv] ($M)
Table 1-2: Total Quarterly Funding, by Type, 2022 [M&A; Venture Capital/Private; IPO/FPO; Collab; SPAC; and Strat inv] ($M)
Table 1-3: Total Quarterly Funding, by Type, 2021 [M&A; Venture Capital/Private; IPO/FPO; Collab; SPAC; and Strat inv] ($M)
Figure 1-3: Total Quarterly Funding, Q1 2021- Q3 2023 ($M)
Figure 1-4: Total Quarterly Funding, by Type, Q1 2021-Q3 2023 [M&A; Venture Capital/Private; IPO/FPO; Collab; SPAC; and Strat inv] ($M)
Quarterly Funding Category Shares, Q1 2021 Through Q3 2023
Table 1-4: Total Quarterly Funding Share, by Type, 2023 [M&A; Venture Capital/Private; IPO/FPO; Collab; SPAC; and Strat inv] (%)
Table 1-5: Total Quarterly Funding Share, by Type, 2022 [M&A; Venture Capital/Private; IPO/FPO; Collab; SPAC; and Strat inv] (%)
Table 1-6: Total Quarterly Funding Share, by Type, 2021 [M&A; Venture Capital/Private; IPO/FPO; Collab; SPAC; and Strat inv] ($M)
Figure 1-5: Total Quarterly Funding Share, by Type, Q1 2021-Q3 2023 [M&A; Venture Capital/Private; IPO/FPO; Collab; SPAC; and Strat inv] (%)
Figure 1-6: 2021 Funding Share, by Type of Funding [M&A; Venture Capital/Private; IPO/FPO; Collab; SPAC; and Strat inv] (%)
Figure 1-7: 2022 Funding Share, by Type of Funding [M&A; Venture Capital/Private; IPO/FPO; Collab; SPAC; and Strat inv] (%)
Figure 1-8: 2023 Funding Share, by Type of Funding [M&A; Venture Capital/Private; IPO/FPO; Collab; SPAC; and Strat inv] (%)
Quarterly Deal Counts by Category, Q1 2021 – Q3 2023
Table 1-7: Quarterly Count of Deals, By 2023 Quarter, By Category [Technology/Research/Strategic Collaboration; Venture Capital/Private Investment; Acquisition, Merger, Strategic Investment; Licensing; Public Offering/SPAC; Manufacturing, Supply Chain; Outreach, Philanthropy, Education; Distribution, Co-Marketing; Spinout, Restructure; Conclude/Terminate Deal; Joint Venture; and Settle Litigation] (total number) (%)
Table 1-8: Quarterly Count of Deals, by 2022 Quarter, By Category [Technology/Research/Strategic Collaboration; Venture Capital/Private Investment; Acquisition, Merger, Strategic Investment; Licensing; Public Offering/SPAC; Manufacturing, Supply Chain; Outreach, Philanthropy, Education; Distribution, Co-Marketing; Spinout, Restructure; Conclude/Terminate Deal; Joint Venture; and Settle Litigation] (total number) (%)
Table 1-9: Quarterly Count of Deals, by 2021 Quarter, By Category [Technology/Research/Strategic Collaboration; Venture Capital/Private Investment; Acquisition, Merger, Strategic Investment; Licensing; Public Offering/SPAC; Manufacturing, Supply Chain; Outreach, Philanthropy, Education; Distribution, Co-Marketing; Spinout, Restructure; Conclude/Terminate Deal; Joint Venture; and Settle Litigation] (total number) (%)
Table 1-10: Yearly Shares of Number of Deals, By Category [Technology/Research/Strategic Collaboration; Venture Capital/Private Investment; Acquisition, Merger, Strategic Investment; Licensing; Public Offering/SPAC; Manufacturing, Supply Chain; Outreach, Philanthropy, Education; Distribution, Co-Marketing; Spinout, Restructure; Conclude/Terminate Deal; Joint Venture; and Settle Litigation], 2021-2023 partial (%)
Growth in Collaborations, Manufacturing/Supply Chain Deals, Licensing, Distribution/ Co-Marketing Highlight Activity in Cell and Gene Therapy
Figure 1-9: Yearly Shares of Number of Deals, By Category [Technology/Research/Strategic Collaboration; Venture Capital/Private Investment; Acquisition, Merger, Strategic Investment; Licensing; Public Offering/SPAC; Manufacturing, Supply Chain; Outreach, Philanthropy, Education; Distribution, Co-Marketing; Spinout, Restructure; Conclude/Terminate Deal; Joint Venture; and Settle Litigation], 2021-2023 partial (%)
Figure 1-10: Most Frequent Types of Deals, by Quarter, by Category [Technology/Research/Strategic Collaboration; Venture Capital/Private Investment; Acquisition, Merger, Strategic Investment; Licensing; Public Offering/SPAC; and Manufacturing, Supply Chain], 2021-2023 partial (Total number)
A Look at Less Frequent CGT Deal Types
Figure 1-11: Lower Frequency Deal Types, by Quarter, by Category [Outreach, Philanthropy, Education; Distribution, Co-Marketing; Spinout, Restructure; Conclude/Terminate Deal; Joint Venture; and Settle Litigation] (total number)